April 2017
In This IssueSpotlight: Innovative Data Tools for Communities, Economic Developers and Businesses
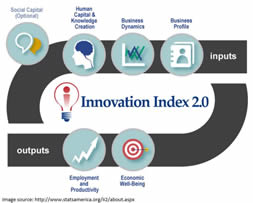
Did you know that EDA partners with businesses and universities through its Research and National Technical Assistance program (PDF) to develop and disseminate “data tools” on emerging economic development concepts? These tools are paving pathways of success for economic development and innovation by helping communities develop strategic plans, locate and evaluate regional clusters, explore existing innovation capacity and much more. For example, the StatsAmerica Innovation Index 2.0 Tool that we highlight in this edition of Innovate@EDA is providing economic development practitioners with a fast, simple way to calculate whether a country, region, or neighborhood may meet EDA eligibility thresholds for unemployment and income. Highlight: StatsAmerica: Energizing Your Region’s Economy with Innovation Index 2.0 StatsAmerica, Innovation Index 2.0 logo EDA’s most recently developed tool is StatsAmerica’s Innovation Index 2.0 (II 2.0). Developed by the Indiana Business Research Center at Indiana University and funded by EDA, this tool provides practitioners an easy-to-compare method of assessing the innovation capacity of their region with data from four areas: human capital, economic dynamics, productivity and employment, and well-being. You may ask, “What is driving innovation in my region?” or “How does my region’s economic landscape compare to other regions?” The new Innovation Index 2.0 can help answer those and many other questions. The new II 2.0 is more comprehensive than the previous innovation index. II 2.0 expands on the original index by adding more than 50 new measures, such as taking into account regional knowledge spillovers, technology diffusion and foreign direct investment. Similar to the first version, county-level data can be aggregated to a regional level based on the user’s needs. These measures reflect contemporary research on understanding and measuring innovation. The Innovation Index 2.0 also provides a set of analytic tools and data that can help regional leaders reach a strong consensus on their region’s strategic direction. Data and analysis can inform stakeholders’ collective action toward a common vision and can guide complex decision-making at a regional-level by identifying region’s capabilities, challenges, and potential. Success Story: The U.S. Cluster Mapping Portal is a Problem-Solving Tool...So What Are You Trying to Solve? U.S. Cluster Mapping Logo Many different types of users visit the U.S. Cluster Mapping and Registry portal, including business economic developers, policymakers, academics, and researchers. Some are trying to effect change in state or national policy, while others are trying to determine a strategy for a region, industry, or organization. But all have one thing in common: they can use the U.S. Cluster Mapping and Registry portal to achieve their goals. You can read some specific examples of how the portal is helping to boost a regional network, teach a class, create an economic forecast, and much more on the Cluster Mapping website. If you have a great use case or testimonial that you would be willing to share, we encourage you to contact: cmp@hbs.edu. |
|
|
|||
Dennis Alvord is Back at EDA!
Following an adventurous, whirlwind tour that had him tackling a number of new challenges and opportunities throughout the Department of Commerce, Dennis Alvord is back at EDA as our Deputy Assistant Secretary for Regional Affairs. Welcome back, Dennis! Read Dennis’ bio. Read Dennis' bio. 7th Americas Competitiveness Exchange a Success
The 7th Americas Competitiveness Exchange on Innovation and Entrepreneurship brought 51 high-level representatives from 27 countries to central Texas to explore global and regional partnerships and economic development opportunities. EDA in the News!
* UF's Startup Incubator, Innovation Hub to Double in Size * Quite Simply Hesperia, CA Works For Business * Tenant moving into Quad C starting Monday * Workforce preparation key to enticing new business to Beaufort Co. EDA Participates in Educational Association of University Centers 2017 Washington Meeting
On March 28, Deputy Assistant Secretary for Regional Affairs Dennis Alvord spoke at the Educational Association of University Center’s 2017 Washington Meeting. EDA’s 58 active University Centers are playing a critical role in linking our higher education system with local and regional economic development organizations, local units of government, private sector companies, non-profits and regional organizations to foster economic and business development. Learn more. Please help us Spotlight your Successes!We are proud of our grantees’ accomplishments and encourage you to submit your success stories: |


